Sunday, May 08, 2005
A Simple Look At RBI Totals
The ability to hit better in critical "clutch" situations has never been statistically proved, and is usually shoved off as luck. I agree with this, although the ability to "choke" seems harder to disprove...
I quote the following from Baseball Graphs word for word.
If you take the statistical totals of any league in baseball history, multiply its OBP by its total bases (the key component of SLG), you will get a number that is almost always within 1% of total league runs scored! When you apply this math to individual teams, you usually get a number within 5% of team runs scored. This is an astounding mathematical concept. The person who discovered this basic truth must have felt like Archimedes, running down the hall naked and shouting "Eureka."
OBP and SLG correlate incredibly well with runs because:
1) get on base (hits + walks = OBP)
2) drive a runner in (total bases = SLG)
For example, the Dodgers scored 761 runs last year. Multiply the team OBP of .332 by .423 SLG by 5542 ABs and you get 774.4. It's a good, quick estimate. This is what I consider the general form of the Runs Created concept, which is:
RC(Ver 1.0) = { (Hits + Walks "OBP")*(Total Bases "SLG") }/(At Bats + Walks)
Introduce some extra terms such as stolen bases and sac flies, and you have the modern version of Runs Created, which is a theoretical value of of runs contributed by a single player.
What I did is a precursor to the Runs Created concept. Instead of multiplying a hitter's SLG by his own OBP, I multiplied a hitter's SLG by the previous hitter's OBP - RBIs mainly happen when you drive in those in front of you after all. For example, I multiplied Ken'ts SLG with Drew's OBP. I then normalized the results a tad because not every run is an RBI. The result is a predicted RBI for a hitter that can be compared to his actual RBI total. Best of all, it's in a format that everybody understands - RBIs.
I realize that this method is simple, is not original, has been tried by a gazillion people, and most have eventually come up with a better solution. I am making no attempt to account for runners prior to the guy infront of the hitter, say the leadoff guy getting on infront of the cleanup hitter. My original grand plan was to embed a Markov run expectancy matrix in a Monte Carlo simulation - a numerical method that usually works well. I don't have the time to code a program, so I am using this ridiculously simple (and crude) method instead.
First, the 04 season:
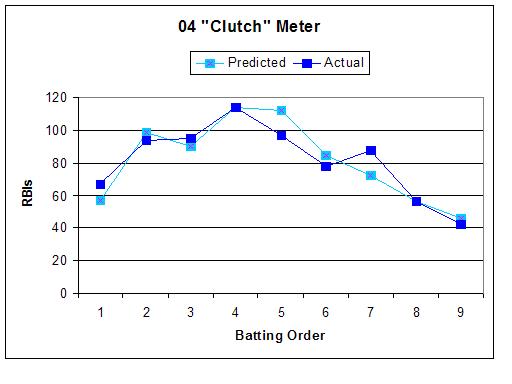
The most "clutch" hitter was the #7 spot, which was usually Encarnacion in the 1st half, and Cora in the 2nd half. Checking their numbers, those two indeed hit better with runners in scoring position last year. The big "choker" was the #5 spot, which was usually occupied by Mr. 0.199 with RISP.
Here is this year's team, as of 5/5/05.
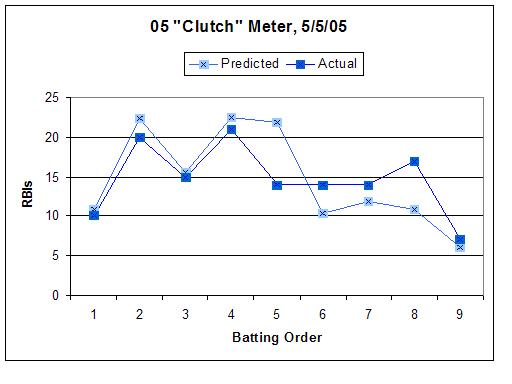
Clutch: The #8 spot, with the catching tandem of Phillips and Bako hitting over .400 with RISP.
Choke: The #5 spot, which is Bradley, who is barely over the Mendoza line with RISP.
In terms of absolute RBI totals, Drew's slump to begin the season is clear at the #3 spot. Choi and Repko have apparently been fine in the #2 hole.
Anyway, I like simplicy... the fact that this method even works is a testament to the importance of OBP and SLG, and not my method, which is full of holes.
![]()