Tuesday, November 08, 2005
Dodger 2006 Home Attendance: 3,417,575
Or at least that's my best estimate without knowing how the club will perform on the field next year. As explained below, over 70% of the variation in home attendance during the Dodger Stadium era can be explained using external (i.e., non-baseball) factors and prior club performance. If you could magically know how the club will play next year, then nearly 90% could be explained. (Why is it that the same magic that tells you how the team plays couldn't just tell you the attendance as well? I don't know -- it's magic. I'm talking stats here, bear with me.) So here are the refined attendance numbers corresponding to how the club finishes in the NL West in 2006:
- 3,564,380
- 3,433,714
- 3,303,048
- 3,172,382
- 3,041,716
What?
So how did I come up with these estimates? Smog's post got me thinking about the relationship between team performance and attendance. So I ran some (linear) regression analyses to see what correlation there is between various measures of performance and attendance. First I looked at the current year's winning percentage, then the prior year's, then averages of prior two years, etc. Surprisingly, I didn't find much correlation at all (e.g., current year's win percentage vs. average per game attendance r^2=.0114, prior year's r^2=.0001). Whether the club made the playoffs or world series also weren't very predictive. Division rank yielded slightly better results (rank current year, r^2=.2106; prior year r^2=.0975), but still not as high a correlation as I expected. [Note on tests of statistical correlation and the reporting thereof: if references to r^2 aren't familiar to you, then take this very perfunctory explanation offered by Microsoft Excel: "The r-squared value can be interpreted as the proportion of the variance in y attributable to the variance in x." In this case, the proportion of variation in Dodger attendance explained (although "explained" is really too strong) by the variation in other factors, such as the Dodger's win percentage. Calculating r^2 values is best left to Excel or other statistics software, and further explanation of statistics is best left to someone else.]
It's More about When than What
So I stepped back and a took at the plotted data to see if anything obvious jumped out at me. FYI, here it is (source: baseball-reference.com) (click on the graph to see a larger, more legible version):
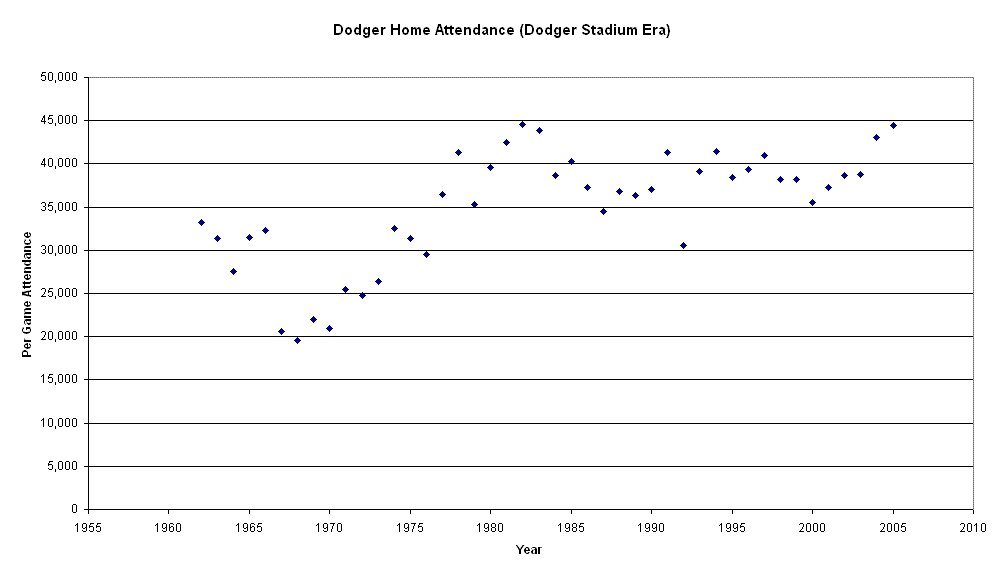 Note that the graph shows per game average attendance, not total annual attendance. I used per game rather than total numbers so strike-shortened seasons could be compared with others. The strikes didn't seem to have much effect on Dodger draw, perhaps because the Dodgers won the series in 81.
The one noticeable thing that stands out to me is the overall steady increase in attendance. In fact, the one factor that best correlated to attendance was simply the year (r^2=.4621). Here's the same chart with a trend line added:
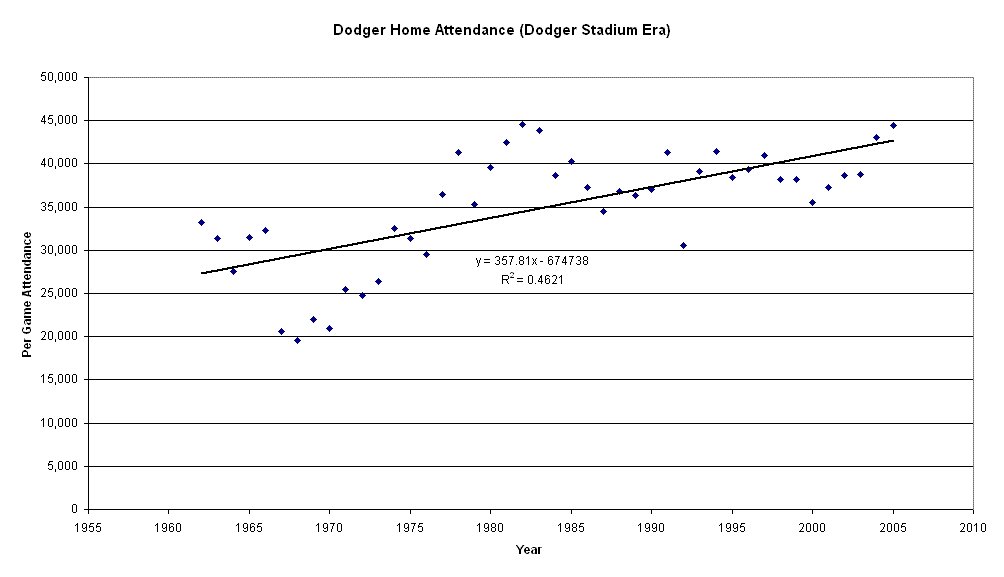 The resulting equation (i.e., the equation of the trend line) is: average Dodger per game home attendance equals 357.81 multiplied by the year minus 674,738. So without looking at baseball factors at all, we could estimate next season's attendance at 43,028.86 per game [43,028.86 = 357.81 * 2006 - 674,738] or 3,528,367 in total (82 games).
 Does this make sense, or is it just luck? Given that baseball factors didn't yield better results, I surmise that the correlation to the year really shows correlation to external (non-baseball) factors such as growth in population, disposable income, etc. To test this I looked up population numbers for the five county area (aka, the Los Angeles-Riverside-Orange County CMSA). Unfortunately, I could only find annual numbers as far back as 1970. Over this period the population correlated fairly well with attendance (r^2=.3005), but not quite as well as years over the same period (r^2=.3525). Perhaps the difference is due to increase in disposable income, expanding economy, etc. It was a big enough pain in the ass hunting through the census info to find annual population data that I decided to punt on testing the economic factors and just settle on using years as a proxy. Besides, I wanted to use all the attendance data from the entire Dodger Stadium era and I only had population data going back to 1970.
The Baseball Factor
So if the general trend toward increase in attendance over the years explains about 46% of the variation in attendance, what about the rest? To test this I compared various baseball factors versus the difference in actual attendance in each season from estimated based upon the foregoing trend equation. In other words, residual analysis. Again I found that divisional rank was far better at predicting attendance than raw win percentage. But what really surprised me was the factor that best correlated with the attendance residuals wasn't the current year's rank, or prior year's, or the average of two or three year's, but it was the club's average divisional rank over the prior nine years (r^2=.3702). Apparently, most Dodger fans have long memories.
Using multivariate regression analysis, we can look at how well these two factors, when taken together, explain the variation in Dodger home attendance. ("Multivariate regression analysis" sounds pretty gnarly, but from a user perspective, it just involves adding another column of data to the spreadsheet.) And the answer is about 68% (r^2=.6851). After testing a number of different factors, I found that the highest correlation between a given year's attendance and things other than current year's performance was about 71% (r^2=.7117). To get this I regressed Dodger home attendance versus four variables: 1) the year; 2) the Dodgers' average divisional rank over the prior nine years; 3) the Dodgers' average divisional rank over the prior three years; and 4) a playoff factor equal to 2 if the Dodgers reached the world series in the prior year, 1 if the Dodgers finished 1st or 2nd in their division in the prior year (i.e., were in the race for the playoffs), or 0 if the Dodgers finished 3rd or lower in their division in the prior year. Here's the resulting equation: average Dodger per game attendance = 283.22878 * the year - 4293.465343 * 9yr av rank - 924.4837235 * 3yr av rank + 878.7310142 * playoff factor - 513,349.8755. Do the math and you should come up the attendance number in the title (or one or both of us has our math wrong).
In order to predict attendance with higher confidence, one must turn to current year performance. Not surprisingly, the most useful current-year factor is division rank. Adding this variable to the analysis described in the prior paragraph allows one to describe nearly 90% of the variation in Dodger home attendance (r^2=.8918). The resulting equation: average Dodger per game attendance = 254.9744543 * the year - 4885.943458 * 9yr av rank - 653.1594398 * 3yr av rank + 1224.126037 * playoff factor - 1593.488331 * current year rank - 452406.8777. Here's what it looks like graphed:
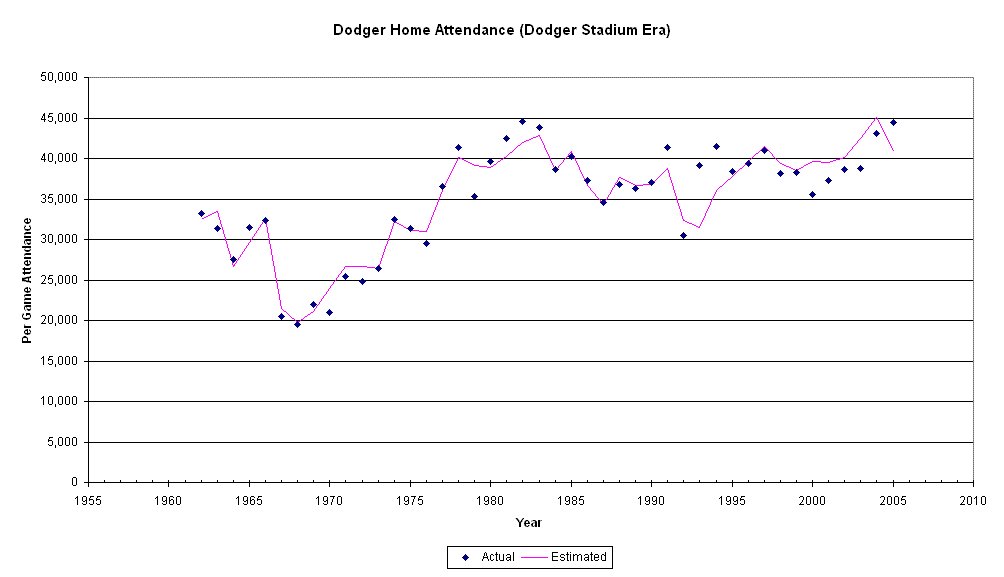 As you can see, the estimate is pretty close to the actual. So what makes up the other 11% variation in attendance? There are lots of possibilities, such as Fernandomania, good/bad PR, or the price of beer. It would be interesting to see if ticket price had much impact, or to see if the correlations that hold true for the Dodgers work for other clubs. I'll leave all that to another day, or maybe Smog will want to take it up.
Comments:
<< Home
this is probably pure coincidence, but it looks like the team didn't draw as well as they should have when green was with LA, 00 to 04. so i guess "Mr. 199 BA with RISP" also choked at the box office...

Smog: might have been partially due to anti-Green sentiment, or maybe anti-Fox sentiment. Maybe it is due in part to the rise in popularity of the Angeles.
Strike4: You certainly could define the trade area more precisely than using all of LA, Orange, Ventura, San Berdo, and Riverside counties. But as I discussed briefly, you really need to get economic data in addition to population data. Because I wanted to focus on baseball factors, I didn't want to spend the time tracking these external data down. If you've got them, feel free to test them youself or email them to me and I'll check them along with the other factors.
One way to test the Angeles as a competitor would be to see if there is a (negative) correlation between the clubs' attendances. My gut says there isn't much of one (especially if you normalize for pop/econ growth). Other pro or even college sports may also have some impact as a large percentage of ticket sales are season tickets which may well be competitive even for sports played at different times of the year. In fact, the construction of Staples and its nice luxury boxes may explain some of the leveling off in the early '00s.
As for a correlation between past team performance and GM (or manager) firings, I would bet there is one. The interesting question would be what lag time is the best indicator. Common wisdom is that one bad season would normally not spell the doom of a GM, but two or three should.
Post a Comment
Strike4: You certainly could define the trade area more precisely than using all of LA, Orange, Ventura, San Berdo, and Riverside counties. But as I discussed briefly, you really need to get economic data in addition to population data. Because I wanted to focus on baseball factors, I didn't want to spend the time tracking these external data down. If you've got them, feel free to test them youself or email them to me and I'll check them along with the other factors.
One way to test the Angeles as a competitor would be to see if there is a (negative) correlation between the clubs' attendances. My gut says there isn't much of one (especially if you normalize for pop/econ growth). Other pro or even college sports may also have some impact as a large percentage of ticket sales are season tickets which may well be competitive even for sports played at different times of the year. In fact, the construction of Staples and its nice luxury boxes may explain some of the leveling off in the early '00s.
As for a correlation between past team performance and GM (or manager) firings, I would bet there is one. The interesting question would be what lag time is the best indicator. Common wisdom is that one bad season would normally not spell the doom of a GM, but two or three should.
<< Home
![]()