Thursday, April 21, 2005
Early Graphs: Pitching & Defense
As a follow-up to the previous article:
To visually see the relationship between line drives given up (pitching) and fielding efficiency (defense), I ran a linear regression and plotted a graph for all NL teams during the 04 season. The data is courtesy of the Hardball Times. LA is the blue dot.

r sq = 0.279, stan err = 0.008
The relationship is straightforward: the less line drives your pitcher gives up, the more likely the fielders will turn balls hit in play into outs. The black line is the best-of-fit trend line using a simple linear regression model.
Some thoughts:
1) Park effects for balls put in play are not incorporated. To my understanding, Dodger Stadum traditionally suppresses doubles and triples.
2) The lowest line drive rate given up was 17.9% by Milwaukee, and the highest was 19.5% by Houston. The difference is only 1.6%.
3) The highest fielding efficiency was 71.1% by LA and St. Louis, and the lowest was 67.8% by Colorado. The difference is only 4.7%.
Over a full 162 game season, the differences are small.
Given a line drive rate, a team above the trend line made more outs than predicted, and hence was a superior fielding team. Likewise, a team below the trend line was an inferior fielding team.
Note how good the Dodgers' defense was last year. Despite the pitchers giving up more line drives than the average team, the fielding efficiency is tied for the highest. So this supports the notion that LA had the best defense in the NL last year. In stark contrast are is Milwaukee, who at 69.5% fielding and 17.9% line drive rate would make them the worst fielding team.
Let's look at the current season, after 13 games. (I know, sample size...) For comparison, the trend line from the 04 season is included as the red line.
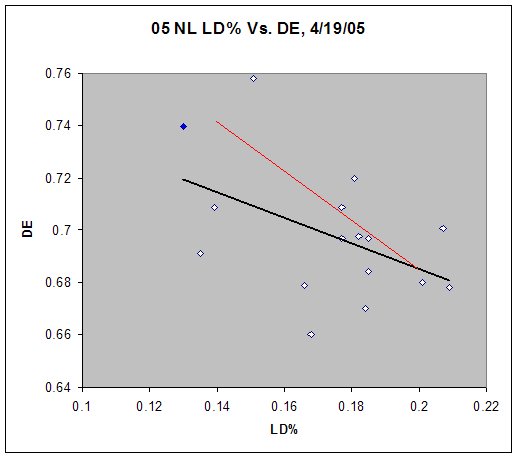
r sq = 0.218, stan err = 0.023
As expected, the R squared value is lower than in the 04 season, and the standard error is higher than the 04 season. That's 13 games versus 162 games in a nutshell, a greater range of values:
1) The lowest line drive rate given up is currently 13% by LA, while the highest is 20.9% by the Cubs. That's a difference of 7.9%.
2) The highest fielding efficiency is 75.8% by Florida, while the lowest is 66% by Arizona. That's a difference of 9.8%.
By the way, the Yankees over in the AL are giving up a line drive rate of 21.1%, while their fielding efficiency is only 64.3%. That is easily the worst combination in the majors, and no wonder they're 5-9 while giving up 6.5 runs a game.
According to this graph, the Dodgers' fielding efficiency so far has been subpar in relation to last year's team and also in relationship to the 04 trend line. Even though LA has the second highest fielding efficiency, one can see from the graph that given the low opponent line drive rate, the efficiency rate has not been stellar, even though LA may be perched above the 05 trend line. Again, sample size and park effect at work...
I think the biggest culprit so far is from having so many new position starters this year, especially the infield. The rotation, with 3 sinkerballers, is inducing more groundballs (1.3 groundout/flyout so far) than last year, and the corner infielders have been especially shaky. Valentin, usually a shortstop, is playing 3B. While 1B Choi has looked decent with the glove, his lack of a bat has meant significant playing time for Grabowski/ Saenz/ Nakamura, not exactly a stellar trio with a 1B glove. Even Izturis has looked shaky at times.
Once again, the sample size is small, so the numbers might be very raw. The park effect for balls in play is not incorporated. However, as the season progresses it's reasonable to think that the infield will improve by repetition and familiarity. It had better, given that the pitchers have so far given up line drives 13% of the time and that last year's NL rate ranged from 17.9% to 19.5%; the 13% rate is almost certain to shoot up by a bunch.
To visually see the relationship between line drives given up (pitching) and fielding efficiency (defense), I ran a linear regression and plotted a graph for all NL teams during the 04 season. The data is courtesy of the Hardball Times. LA is the blue dot.
r sq = 0.279, stan err = 0.008
The relationship is straightforward: the less line drives your pitcher gives up, the more likely the fielders will turn balls hit in play into outs. The black line is the best-of-fit trend line using a simple linear regression model.
Some thoughts:
1) Park effects for balls put in play are not incorporated. To my understanding, Dodger Stadum traditionally suppresses doubles and triples.
2) The lowest line drive rate given up was 17.9% by Milwaukee, and the highest was 19.5% by Houston. The difference is only 1.6%.
3) The highest fielding efficiency was 71.1% by LA and St. Louis, and the lowest was 67.8% by Colorado. The difference is only 4.7%.
Over a full 162 game season, the differences are small.
Given a line drive rate, a team above the trend line made more outs than predicted, and hence was a superior fielding team. Likewise, a team below the trend line was an inferior fielding team.
Note how good the Dodgers' defense was last year. Despite the pitchers giving up more line drives than the average team, the fielding efficiency is tied for the highest. So this supports the notion that LA had the best defense in the NL last year. In stark contrast are is Milwaukee, who at 69.5% fielding and 17.9% line drive rate would make them the worst fielding team.
Let's look at the current season, after 13 games. (I know, sample size...) For comparison, the trend line from the 04 season is included as the red line.
r sq = 0.218, stan err = 0.023
As expected, the R squared value is lower than in the 04 season, and the standard error is higher than the 04 season. That's 13 games versus 162 games in a nutshell, a greater range of values:
1) The lowest line drive rate given up is currently 13% by LA, while the highest is 20.9% by the Cubs. That's a difference of 7.9%.
2) The highest fielding efficiency is 75.8% by Florida, while the lowest is 66% by Arizona. That's a difference of 9.8%.
By the way, the Yankees over in the AL are giving up a line drive rate of 21.1%, while their fielding efficiency is only 64.3%. That is easily the worst combination in the majors, and no wonder they're 5-9 while giving up 6.5 runs a game.
According to this graph, the Dodgers' fielding efficiency so far has been subpar in relation to last year's team and also in relationship to the 04 trend line. Even though LA has the second highest fielding efficiency, one can see from the graph that given the low opponent line drive rate, the efficiency rate has not been stellar, even though LA may be perched above the 05 trend line. Again, sample size and park effect at work...
I think the biggest culprit so far is from having so many new position starters this year, especially the infield. The rotation, with 3 sinkerballers, is inducing more groundballs (1.3 groundout/flyout so far) than last year, and the corner infielders have been especially shaky. Valentin, usually a shortstop, is playing 3B. While 1B Choi has looked decent with the glove, his lack of a bat has meant significant playing time for Grabowski/ Saenz/ Nakamura, not exactly a stellar trio with a 1B glove. Even Izturis has looked shaky at times.
Once again, the sample size is small, so the numbers might be very raw. The park effect for balls in play is not incorporated. However, as the season progresses it's reasonable to think that the infield will improve by repetition and familiarity. It had better, given that the pitchers have so far given up line drives 13% of the time and that last year's NL rate ranged from 17.9% to 19.5%; the 13% rate is almost certain to shoot up by a bunch.
Comments:
<< Home
i just realized that i should have had fielding effiency on the y axis as the dependent variable and LD% on the x axis as the independent variable. you have to hit the ball before you catch it, after all - my bad. (2nd yr undergrad stats was many years ago...) i reran the it that way, and the "slope" is minus 0.95, which i think a tad high considering that about 75% of line drives turn into hits.
if i have time, i'll update the graphs.
Post a Comment
if i have time, i'll update the graphs.

<< Home
![]()